1. International standards
2. Color perimetry: a more sensitive detection of early visual filed defects
3. Accurate, fast Visual Testing
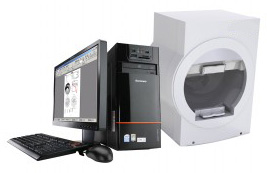
Appearance
Split type
Stimulating way
Optical projection
Projection surface
Aspheric projection arc
Detection method
Static perimetry, Dynamic Perimetry
Detection scope
0-90 Degree
Brightness Level
0-51db
Testing Distance
300nm
Visual Target Color
Red, Blue, White
Visual Target Brightness
0asb-10000asb
Background Light
White(31.5asb), yellow(315asb)
Vision Target Interval time, keeping time
Patients adaptive, standard, slow ,custom
Pupil size Measurement
Auto
Head Movement way
AEC eye position monitoring and automatic correction system
Brightness Measurement
Brightness Auto Measurement and correction
Visual Target Size
(Goldmann standard)
I Grade II Grade III Grade IV Grade V Grade
Detection strategy
Full-threshold, fast threshold, custom, two notation, three notation,
quantify detects, Intelligent dynamic, fast intelligent dynamic
Threshold policy
Age-related, threshold-related, single strength
Static Perimetry
Threshold test Mode
Center10-2,center 24-2,Center 30-2,center 60-4,Nasal step, macula
Screening, special test mode
Center 40,center 64,center 76,center 80,centerarmaly,peripheral 60,
Nasal step, Armaly Full Filed, Full Filed 81,Full Filed 120,Full Filed 35,
Full filed 246,supper 36,upper 64,Easterman monocular, Easter man binocular
Dynamic Perimetry
Dynamic program
Manual procedures, standard procedures(Standard 45, Standard 30,
a high resolution 15)Static point map, Dark spot map, Blind spot map,
custom can, custom dynamic program)
Stimulation parameters
Adjustable(Speed 1-9/s,visual target size, color, intensity, test ranges, etc)
Fixation monitoring
Dynamic real-time video monitoring, physiological blind spot monitoring,
eye tracking curve, eye position offset alarm
Analysis Software
Reliability analysis, single vision analysis, triple report analysis,
overview vision analysis, GHT glaucoma semi vision analysis,
GPA glaucoma developing analysis
Report Figure
Value map, grayscale map, the overall bias decibel chart,
the overall deviation probability map, chart pattern deviation decibels,
pattern deviation probability plot, starting Figure.
       |
 |
 |
 |
 |
|

|
|
